Table of contents

ML lifecycle - coursera.org/learn/introduction-to-machine-..
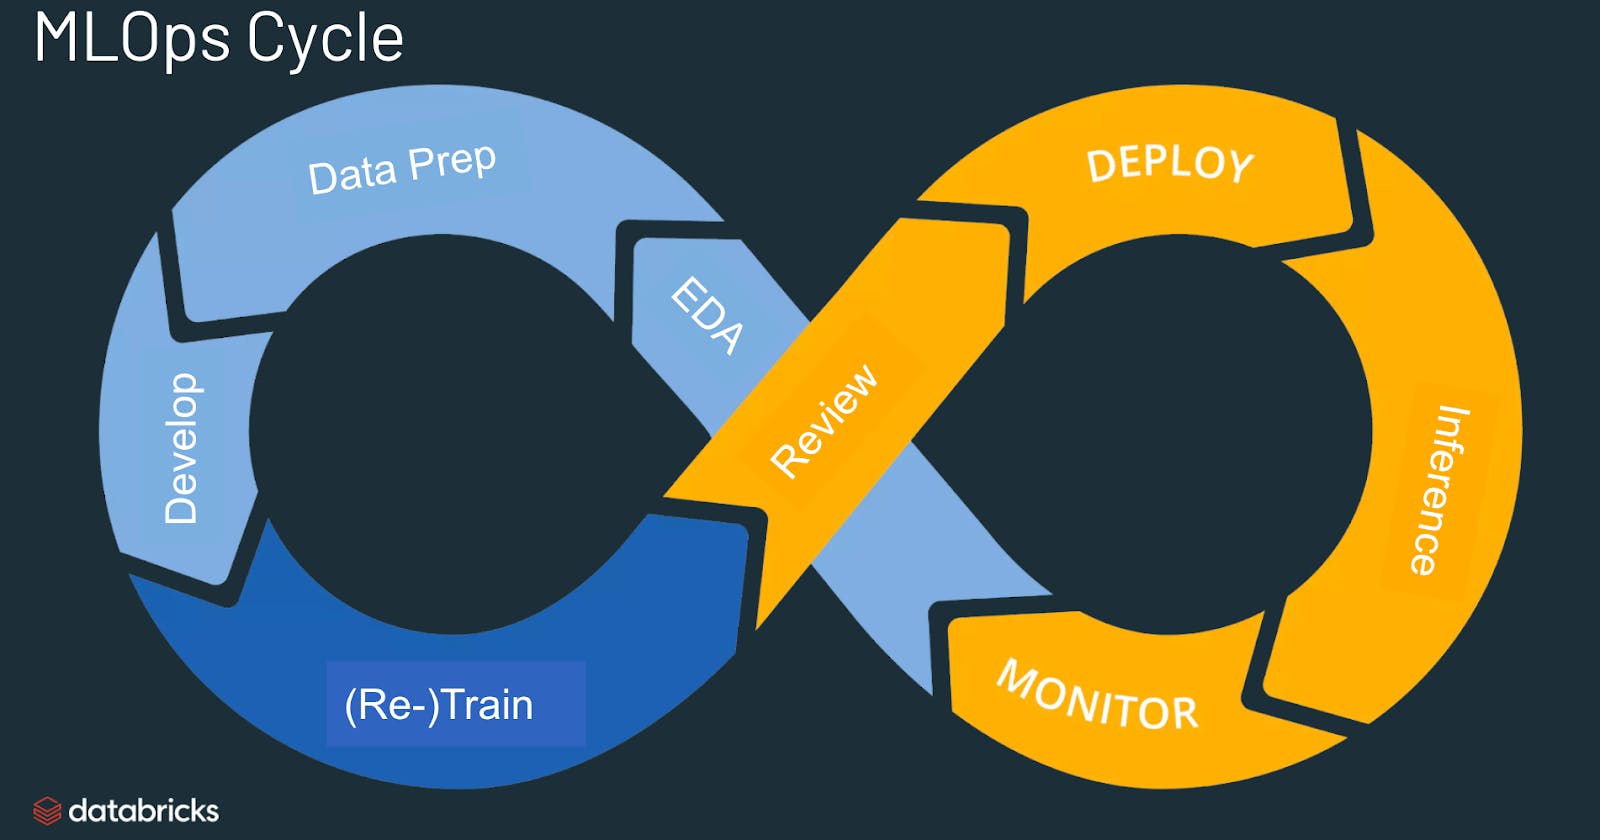
This course introduces us to the ML lifecycle and some real life examples (yes, ML is not just used to predict house prices on a Jupyter notebook!). It walks through the different phases.
Scoping - What projects to work on, what values it brings, what metrics to use when measuring performance and some ballpark resource estimates.
Data - How much data is needed and where it comes from. Ensure data is labelled consistently and establish baselines.
Modelling - Instead of a model centric view (optimizing code & hyper-parameters), optimize data & hyper-parameter.
Deployment - Deploy and monitor for performance, data drift, and concept drift. Go back & tweak model & data to stay relevant.
Let's take a deeper look at the steps, in reverse order.
Deployment
There are a few deployment patterns:
Canary deployment - roll out to a very select few, monitor & ramp up gradually. Great for new projects with not well defined baselines.
Shadow mode - Where human are in charge of decision, but a ML system too predicts & its performance it tally-ed with human operators & tweaked till required confidence is achieved.
Blue/Green deployment - That gradually routes traffic to the new system (green), and in case there is any issue, it is rolled back to the previous version (blue). Ideal for upgrade situations.
Once the system is deployed, it needs to be closely monitored.
Have dashboards and set relevant alerts. Brainstorm metrics to track and alert thresholds, but being an iterative process, can be altered with time.
Often ML systems have pipeline, and changes trickle down. Need to closely tap on to important nodes in the process.
Modeling
Some key challenges in modelling are as follows:
It needs to do well on training set, test set and also fulfill business goal.
Often some segment of data is disporportionately important, example - searches for specific websites vs searches for recipes.
The model should ideally be free from biases & social prejudices.
Perform appropriately for rare classes, like medical screening of a rare disease.
To judge the performance of a model, it is crucial to have a baseline against which it could be held up to and define what is irreducible error (Bayes error). Some ways to estimate that are:
Human level performance (HLP) - great for unstructured data (image, audio, ...)
Literature search (published papers) or open source implementations. Often decent algorithm with good data will outperform smarter algorithm with worse data (remember GIGO?)
Quick & dirty implementation
Performance of older system (if any)
Once a model is shortlisted, it's performance is evaluated and error analysis is done to find the next step. A good way to start is manually going over ~100 or so examples and tag why they were misclassified. based on the difference between the ML model and HLP on tags, and their expected distribution it is decided how to boost those tags.
For skewed datasets, precision-recall and F1 score are better metric than accuracy.
In case of less data, data augmentation can be used (like adding different noises in image and audio, tweaking brightness/contrast of image or video). But augmentation should be realistic - adding stadium noise to a hospital system might not help.
For big models and clear input to output mapping, more data seldom hurts, but for smaller networks or unclear mappings, augmented data might overfit the system.
As an alternative to adding data, adding features too can help, but generally useful in structured data scenarios.
With a highly iterative step of modelling & evaluation it is essential to keep track of what all was tried and how well it turned out. It can be done using text files, spreadsheets or more complicated experiment tracking sytems (Weights & biases, ML Flow, SageMaker, ...). It should track:
Algorithm/code version
Dataset used (processing done if any)
Hyper-parameters
Results
Data
In this phase, it is defined what input x is and what output y is desired.

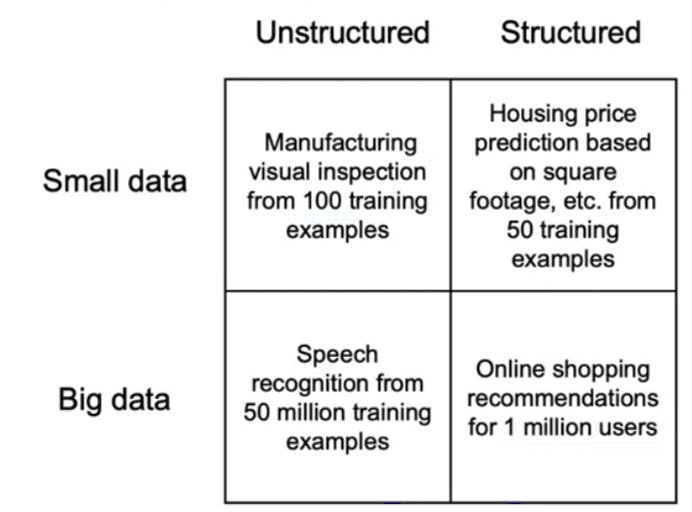
Types of data problems - coursera.org/learn/introduction-to-machine-..
For unstructured data, HLP can generally be evaluated, and augmentation likely to help.
For structured data, HLP & augmentation is difficult.
For small data, clean labels are crucial.
For larger data, data processing pipeline becomes crucial.
When label consistency is required it is often beneficial to discuss among labelers and SME and define and document the output category. It might be needed to have some data have ambiguity and have a new label to denote that.
We should not spend too long to acquire data. Getting into the iterative process as fast as possible is helpful as it illuminates where to focus effort. In case of a well documented domain (like spam filter), when folks know what data works best, it is recommended to spend more time to get good data at the get go. As for data sources, chosing one (or more) depends on monetary cost, timeline and volume of data needed or available.
During the initial (POC) phase, data cleaning and feature extraction can be local scripts of notebooks, but then a proper pipeline needs to be set.
It might be beneficial to keep track of metadata (camera settings, geotag, device type, ...). It is useful for error analysis data provenance.
It is crucial to have same distribution in train, dev and test sets. Use "startified" to get splits.
Scoping
What problems to work on, what is the metric of success, what resources are needed?
Feasibility - Is is feasible technically? What is HLP? Are there features that are indicative of outcome?
Value - Engineers & business metric are generally different, and needs establishing a common ground. Also needs ethical considerations - societal benefit, free from bias, ...
Milestones & Resourcing - Ballpark estimations (ML metrics, Software metric, business metric, resource, timeline).
With this knowledge under my belt, I am happy to share my 1st certificate in this specialization.

Course Completion Certificate - coursera.org/share/85a7ccaba778f72a53147f1d..

